Russia ceases to be a raw materials appendage?
Today, only the lazy does not talk about the curse of the oil needle. The growth of the share of oil revenues of Russian exports to many does not give rest and is interpreted by some liberal economists only as a sign of the looming decline of Putin’s system.
If you look at the data export structure Federal State Statistics Serviceit is easy to see that from 1995, the share of mineral raw materials, or more simply, oil and gas in the export structure has almost doubled - from 42% to 70% in 2011. At the same time, the nominal growth in mineral exports increased more than 10 times, from 33 billion dollars in 1995 year to 362 billion dollars in 2011 year.
The graph below shows the change in the volume of Russian exports from 1995 of the year by groups of goods in millions of US dollars in prices of the corresponding year.
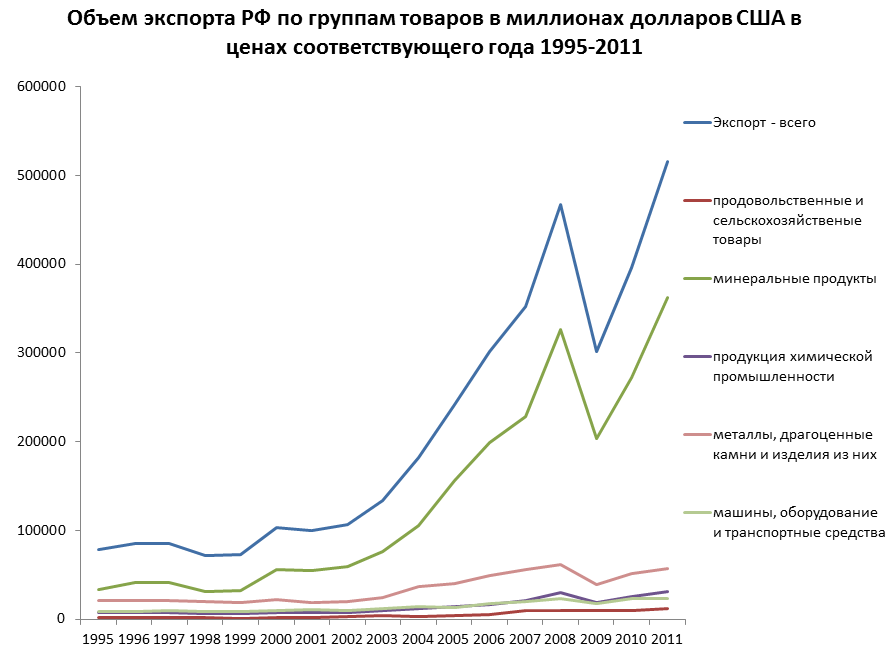
The graph shows that the volume of exports of mineral products grew faster than any other goods.
For ease of perception of the picture, we divide all products into two groups, mineral products and other products.

The above graph clearly shows the results of the destructive economic policies pursued by Putin and his team. Under Yeltsin, exports of minerals and other products were almost equal, but since 2000, the share of exports of minerals has grown very rapidly and in 2011, it already doubled the share of other products.
There is one BUT truth here - the rise in oil prices.
The graph below shows the change in the price of oil per barrel in the international market from 1995 of the year in US dollars.
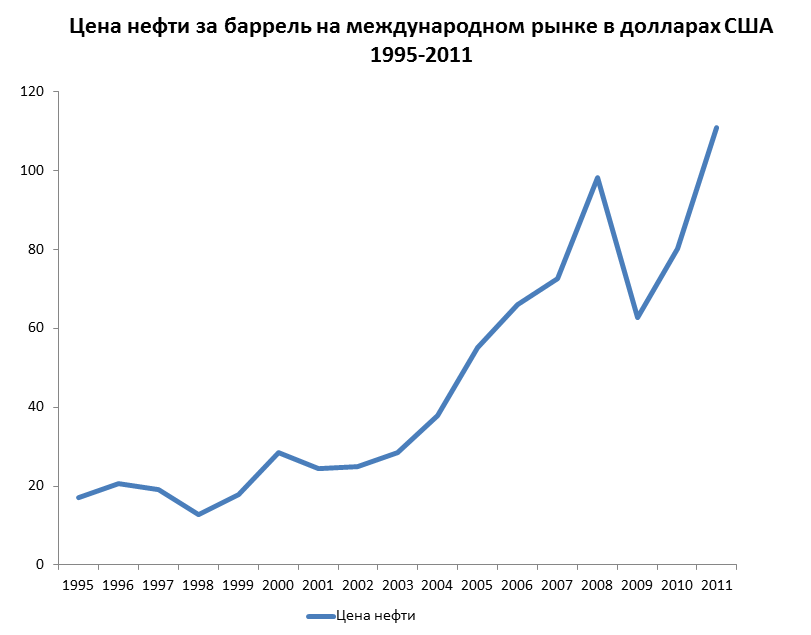
The price of oil in 1995 was 17 dollars per barrel, and in 2011 already 110. That is, growth over 16 years was 6,5 times.
Since the prices of other products did not stand still, but were subject to inflation, it will not be superfluous to look at how the price of the dollar has changed since 1995 of the year.

We see that the dollar in 16 years lost about a third of its value.
If we apply dollar inflation and the change in the price of oil prices to the second chart, we will get this completely unexpected picture.
Changes in the volume of Russian exports, taking into account inflation and rising prices for 1995-2011 oil in millions of US dollars in 1995 prices
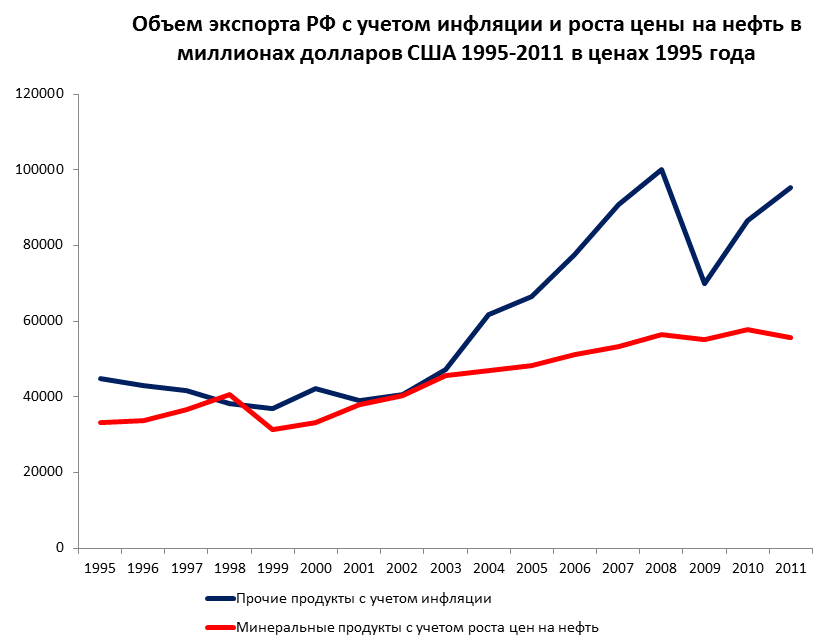
Speaking in simple Russian, if prices had not changed since 1995, we would be surprised to find that the volume of exports of non-mineral products would grow at a faster pace. Even more curious is the fact that intensive growth began in the first half of the 2000s.
Here is the change in the volume of exports of goods with inflation in prices 1995 year.
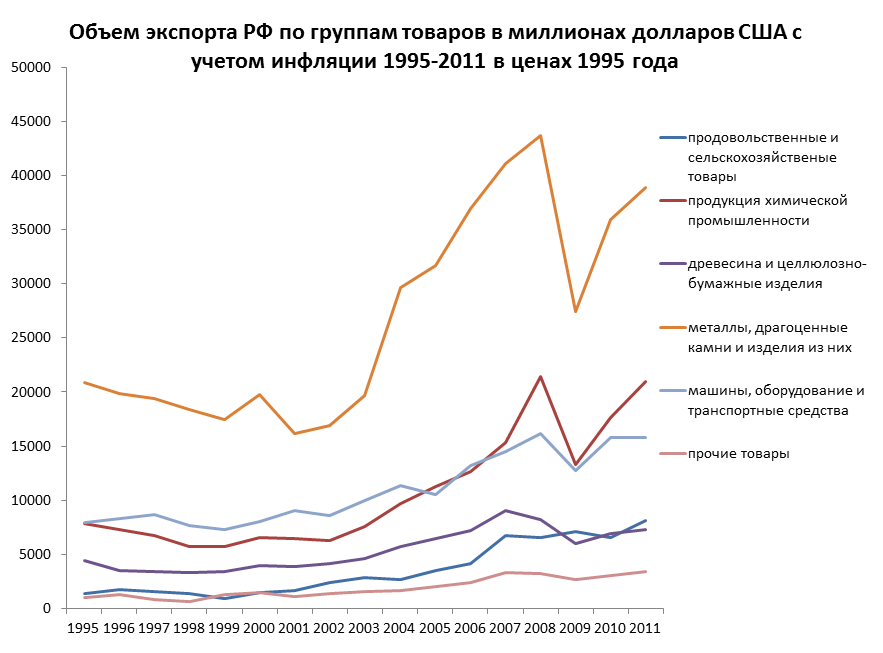
Below are the data on changes in the real export volume of some products with the highest growth rates:
• Food and agricultural products - increase 5,8 times
• Products of the chemical industry - increase 2,6 times
• Machinery, equipment, and vehicles — 2 fold increase.
I want to summarize all the above with the following conclusion: the growth in the share of exports of mineral products such as oil and gas is a natural process caused by a sharp rise in energy prices in recent years, and not at all a sign of some problems in the Russian economy.
In order for a rapid increase in oil prices to maintain a high share of exports of non-primary products, it is necessary either to significantly accelerate the growth rate of industrial production — it had to be about tenfold in 15 years or significantly reduce the volume of oil exports.
The first alternative seems to me not very realizable, the second is not very logical.
Information